Overview
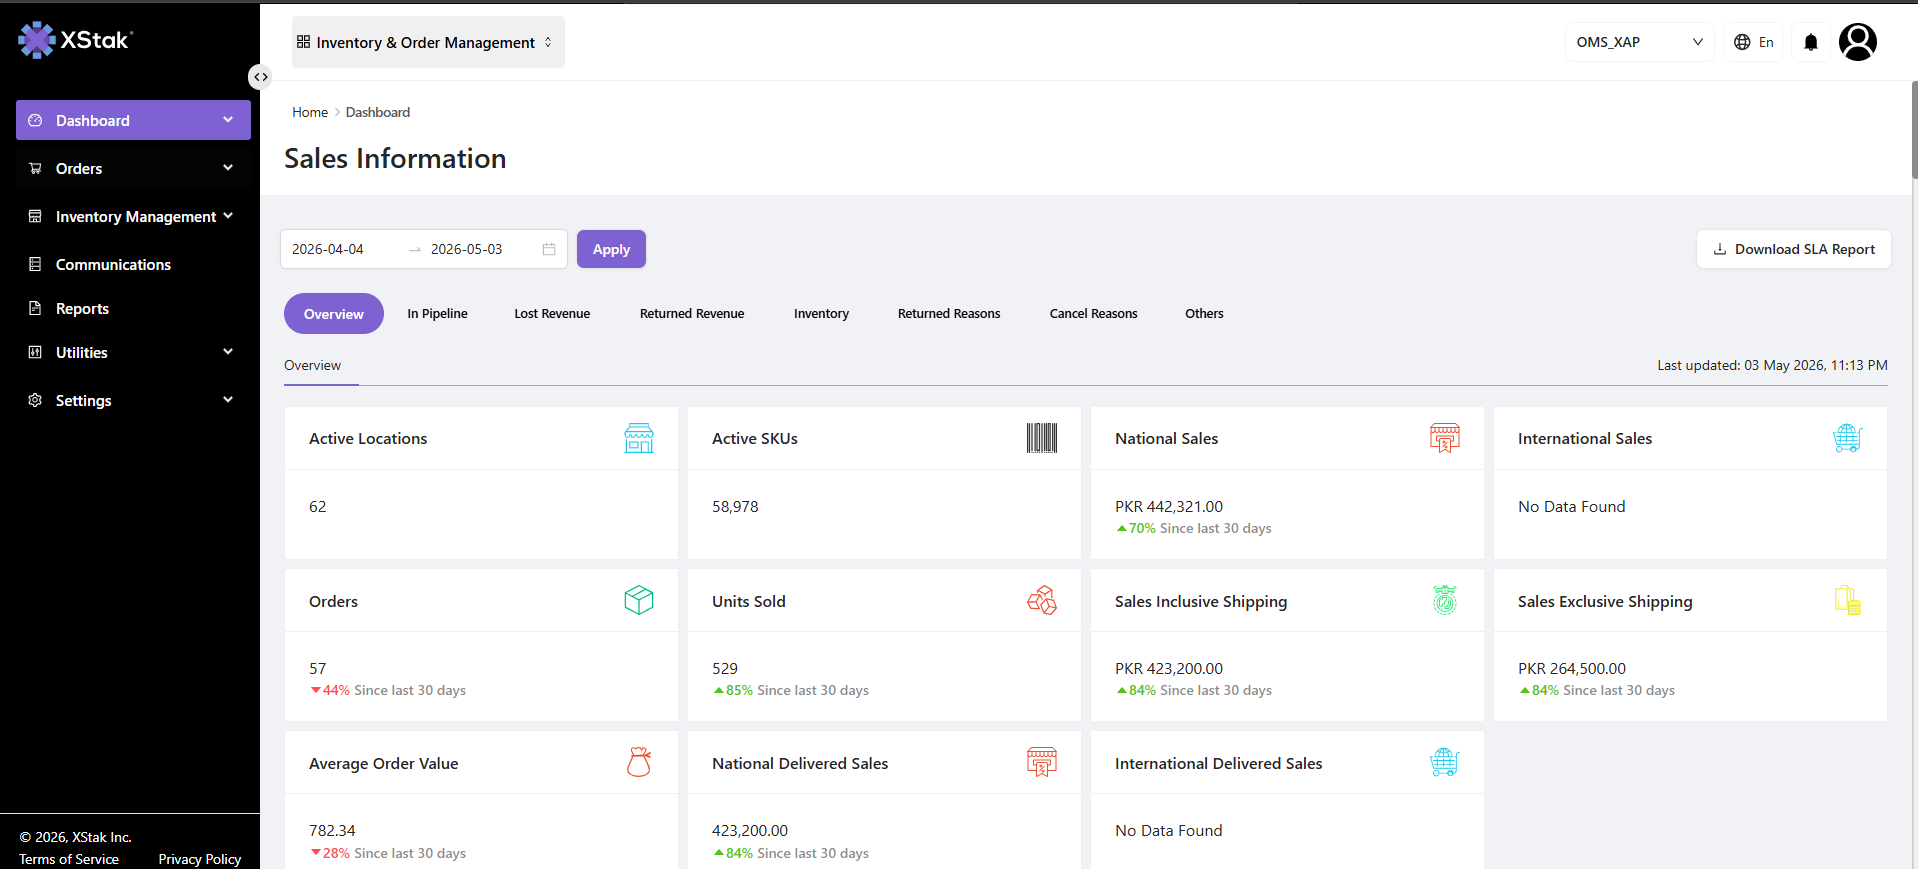
The Dashboard module in XStak OMS serves as the central analytical and monitoring hub of the system. It provides a real-time view of business performance, operational efficiency, and logistics execution through structured and interactive data sections.
This document is intended for OMS users, operations teams, and business stakeholders who need to understand how to access and use the XStak OMS Dashboard for monitoring sales, fulfillment, and logistics performance.
The Dashboard is divided into two primary sections, each designed to serve a different business purpose:
-
Sales Information — Tracks commercial performance, including order volumes, revenue trends, and sales activity across channels.
-
Analytics Dashboard — Provides operational insights such as fulfillment performance, logistics KPIs, courier activity, and delivery execution.
These two sections together provide a complete view of both commercial performance (sales side) and operational execution (logistics and fulfillment side).
How to Access the Dashboard
To access the Dashboard module:
Prerequisite: Users must have valid OMS access and the required dashboard permissions assigned to their role. If the Dashboard option is not visible, contact the system administrator or access control team.
-
Log in to the XStak OMS platform
-
From the left navigation menu, click Dashboard
-
The Dashboard will open with two main sections:
-
Sales Information
-
Analytics Dashboard
-
Using Dashboard Filters and Interactions
Each section contains multiple tabs and reports that can be accessed using the top navigation and available filters. Depending on the report, users may be able to filter data by date range, sales channel, warehouse, courier, fulfillment status, or other operational attributes.
Where available, exported reports can be downloaded for further analysis or sharing with internal teams.
Data freshness note: Dashboard data is intended to provide a near real-time view of business and operational performance. Refresh frequency may vary by report, so users should refresh the page or confirm with the system administrator if the latest figures are required for time-sensitive decisions.
Key Metrics at a Glance
|
Metric |
What it indicates |
|---|---|
|
Total Orders |
Overall order volume for the selected period. |
|
Revenue / Sales Value |
Commercial performance generated through successful sales activity. |
|
Pending Fulfillment |
Orders that still need to be processed, packed, or dispatched. |
|
Delivery Performance |
Success rate and progress of shipments across courier partners. |
|
Returns / Exceptions |
Orders requiring attention due to returns, failed delivery attempts, or operational issues. |