Analytics Dashboard
This document is intended for OMS users, operations teams, logistics managers, finance teams, and business stakeholders who need to monitor courier performance, dispatch efficiency, return trends, and courier settlement status.
Purpose: Use this dashboard to understand logistics health, identify operational bottlenecks, compare courier performance, and support data-driven decisions across dispatch, delivery, returns, and reconciliation workflows.
The Analytics Dashboard provides a logistics and operational performance view of the business. It focuses on courier performance, city-level distribution, dispatch behavior, returns analysis, and financial reconciliation.
Unlike Sales Information, this section answers questions such as:
-
How efficiently are orders being dispatched and delivered?
-
Which cities generate the most returns or shipments?
-
How are couriers performing operationally?
-
What is the financial status of courier settlements?
Prerequisites
-
User must have valid OMS access.
-
User role must include permission to view the Dashboard and Analytics Dashboard modules.
-
Courier, dispatch, return, and settlement data should be available for the selected date range.
-
If the Analytics Dashboard option is not visible, contact the OMS administrator to review access permissions.
Key Metrics at a Glance
|
Metric |
What it shows |
Why it matters |
|---|---|---|
|
Dispatched Orders |
Total orders dispatched through couriers. |
Helps measure outbound logistics volume and operational workload. |
|
Returned Orders |
Orders returned after dispatch, grouped by city or courier. |
Highlights return-heavy locations or courier-level delivery issues. |
|
Delivered Orders |
Orders successfully delivered by each courier. |
Supports courier performance and delivery success evaluation. |
|
Courier Receivables |
Amounts expected, received, and pending from courier partners. |
Supports financial reconciliation and settlement tracking. |
|
City-wise Distribution |
Dispatch and return trends by city. |
Helps identify regional demand, fulfillment pressure, and return patterns. |
How to Use Analytics Dashboard
-
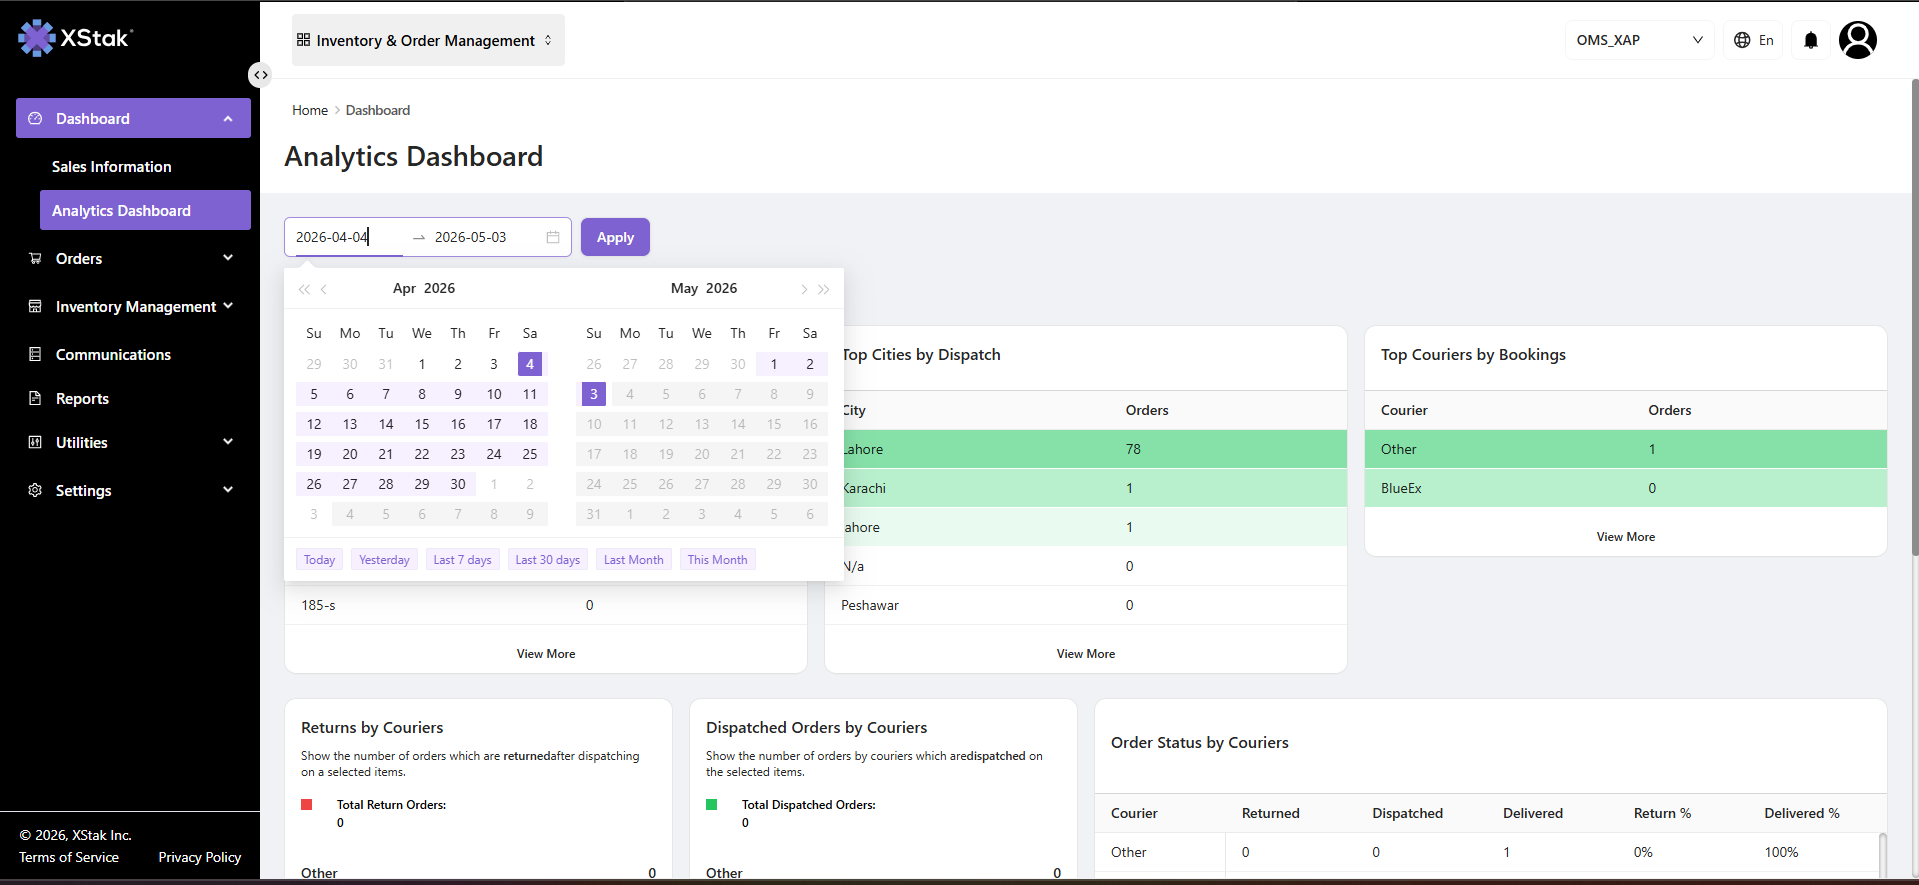
Navigate to Dashboard → Analytics Dashboard
-
Select the required date range filter
-
Review the analytical sections below the filter
All data is dynamically updated based on the selected time period.
Filters & Interactions
-
Date range filter: Adjust the reporting period to review logistics performance for a specific day, week, month, or custom time range.
-
Dashboard drill-down: Review each section to compare courier, city, dispatch, return, and settlement trends.
-
Export option: Use the available download option in the receivable report section to export courier-wise financial data for reconciliation and offline analysis.
-
Refresh behavior: Data updates dynamically based on the selected time period. Refresh the page or update filters to ensure the latest available figures are displayed.
Data freshness note: The dashboard provides a near real-time operational view based on OMS data availability. Final figures may vary if courier updates, returns, or settlement records are still being synced.
Key Sections Explained
Logistics Reconciliation Section
This section provides a consolidated view of logistics performance across dispatch, returns, courier activity, and financial tracking.
It helps teams understand overall operational efficiency across the courier network.
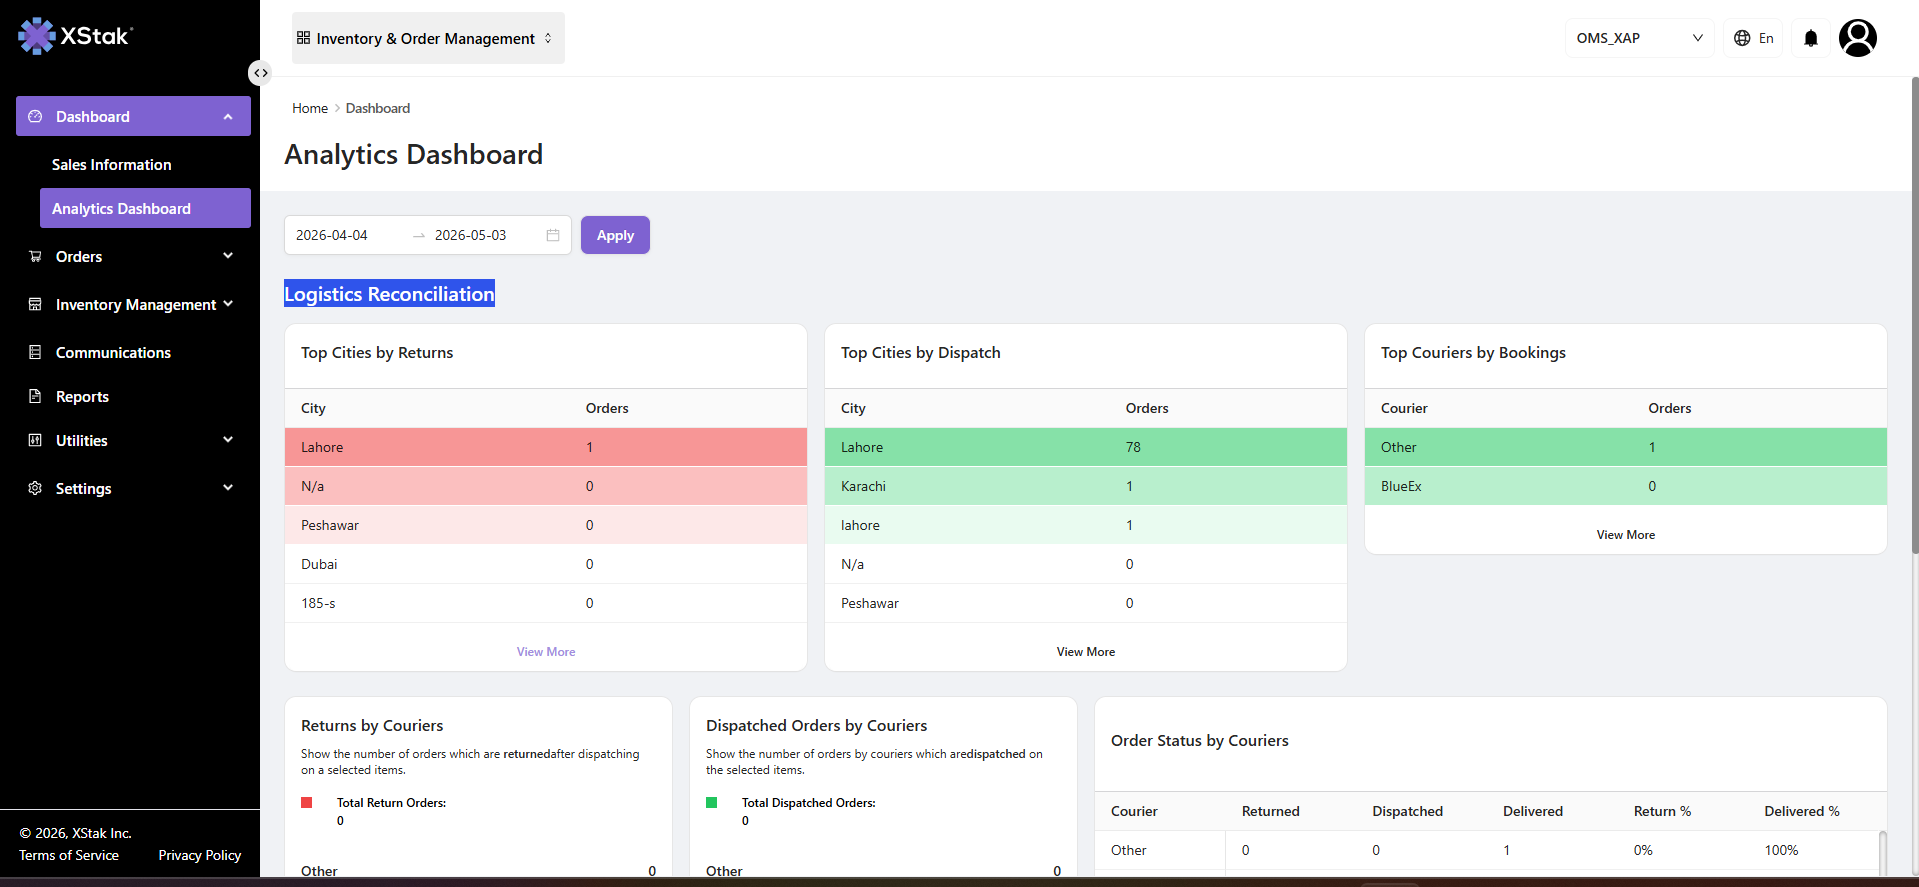
Top Cities by Returns
This section highlights cities with the highest number of returned orders within the selected date range.
It is used to identify:
-
Regional return patterns
-
Potential delivery or fulfillment issues
-
Customer behavior trends by geography
Top Cities by Dispatch
This section shows cities with the highest order dispatch volume.
It helps in understanding:
-
High-performing fulfillment regions
-
Operational load distribution across cities
-
Demand concentration areas
Top Couriers by Bookings
This section displays courier usage based on the number of orders assigned.
It is used to analyze:
-
Courier allocation trends
-
Logistics partner usage distribution
-
Operational dependency on couriers
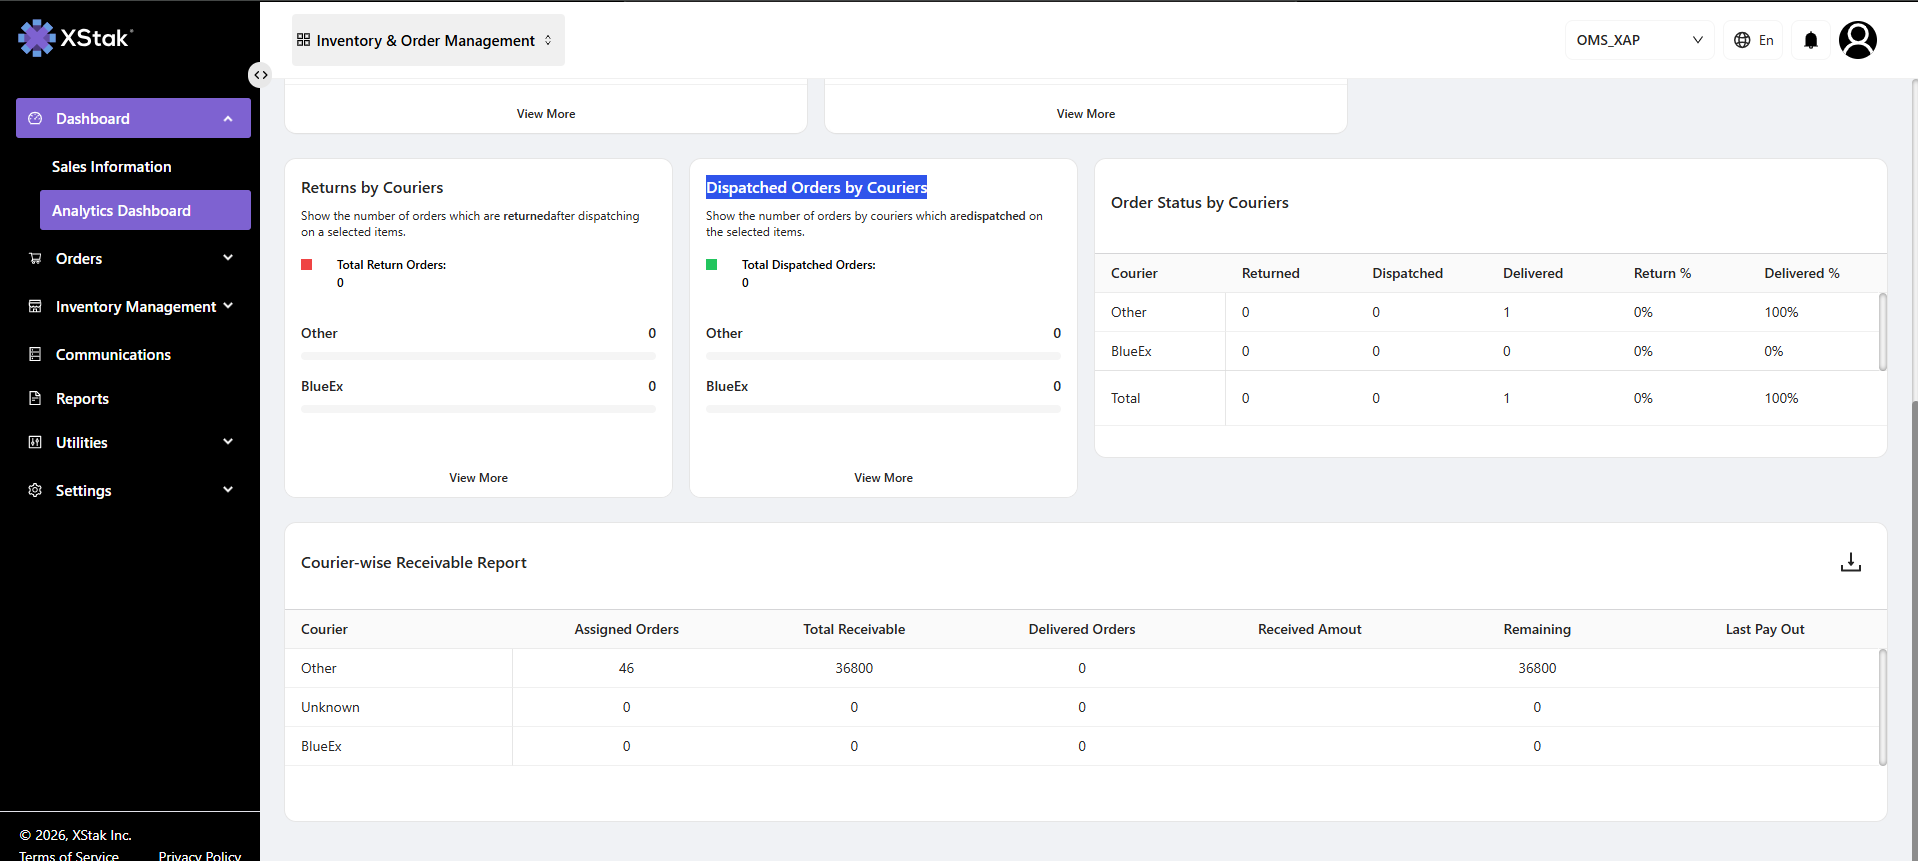
Returns by Couriers
This section shows the number of orders returned after dispatch, grouped by courier.
It helps teams identify:
-
Courier-level return issues
-
Delivery quality concerns
-
Post-dispatch failure patterns
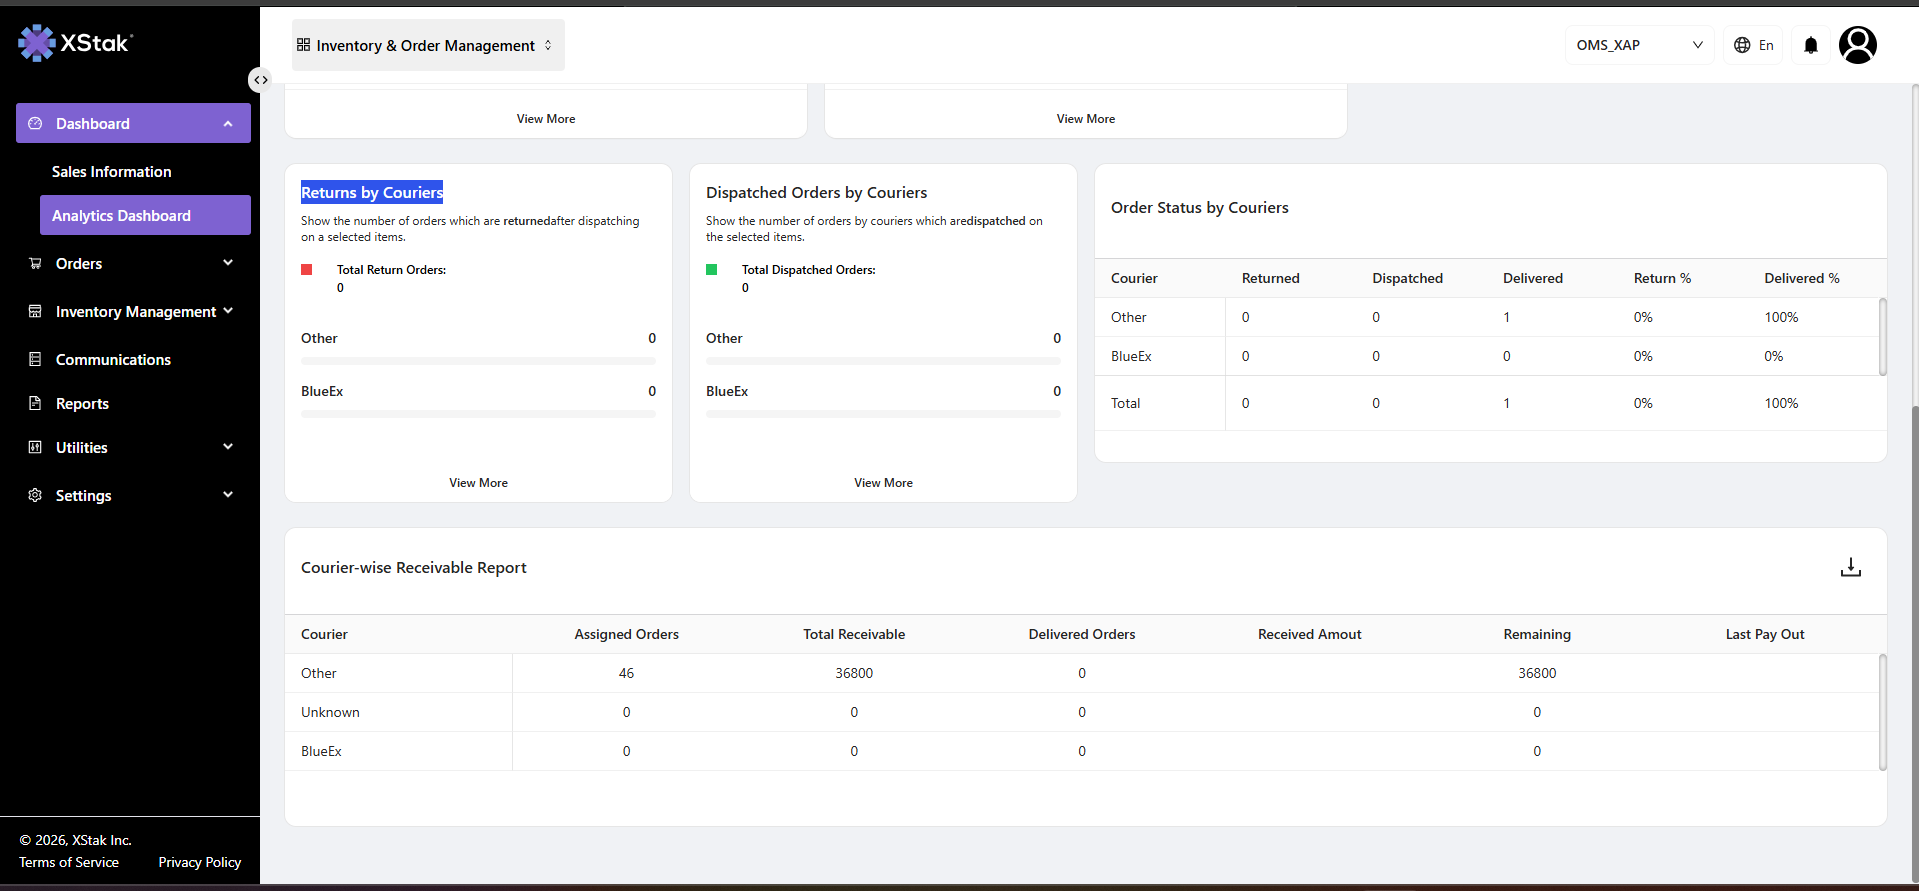
Dispatched Orders by Couriers
This section displays total orders dispatched through each courier.
It is used to:
-
Track courier activity levels
-
Understand dispatch distribution
-
Monitor logistics execution volume
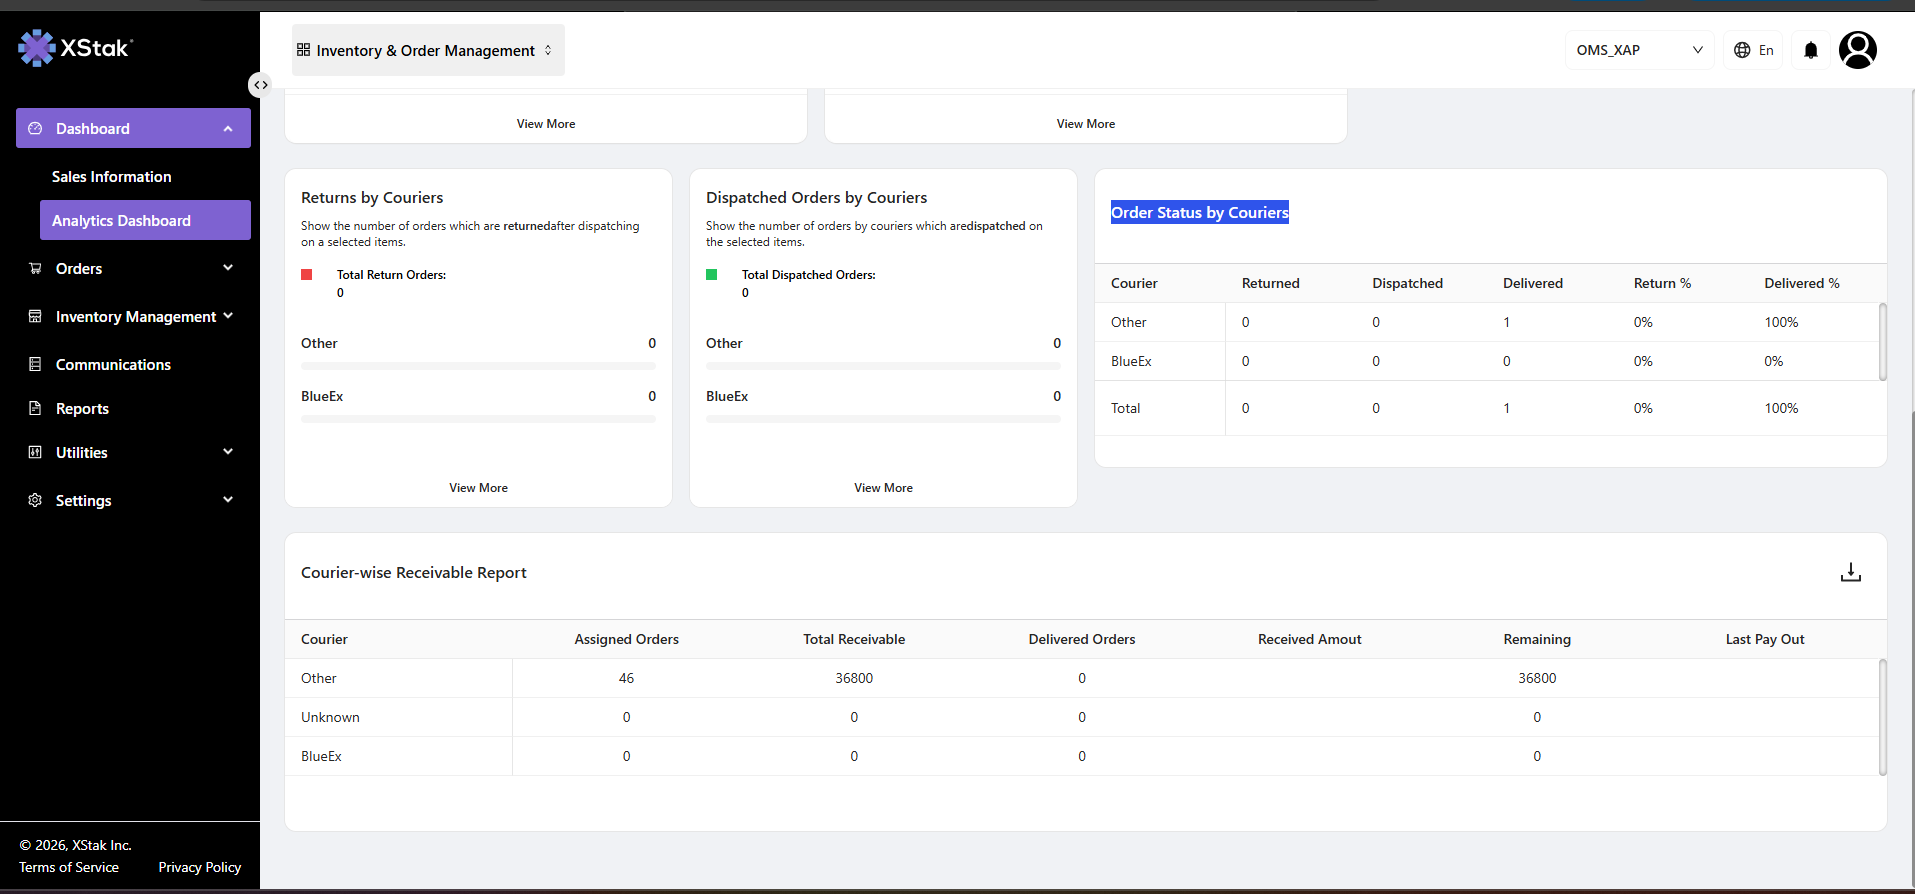
Order Status by Couriers
This section provides a combined view of courier performance across returned, dispatched, and delivered orders.
It helps evaluate:
-
Courier efficiency
-
Delivery success rate
-
Return ratio per courier
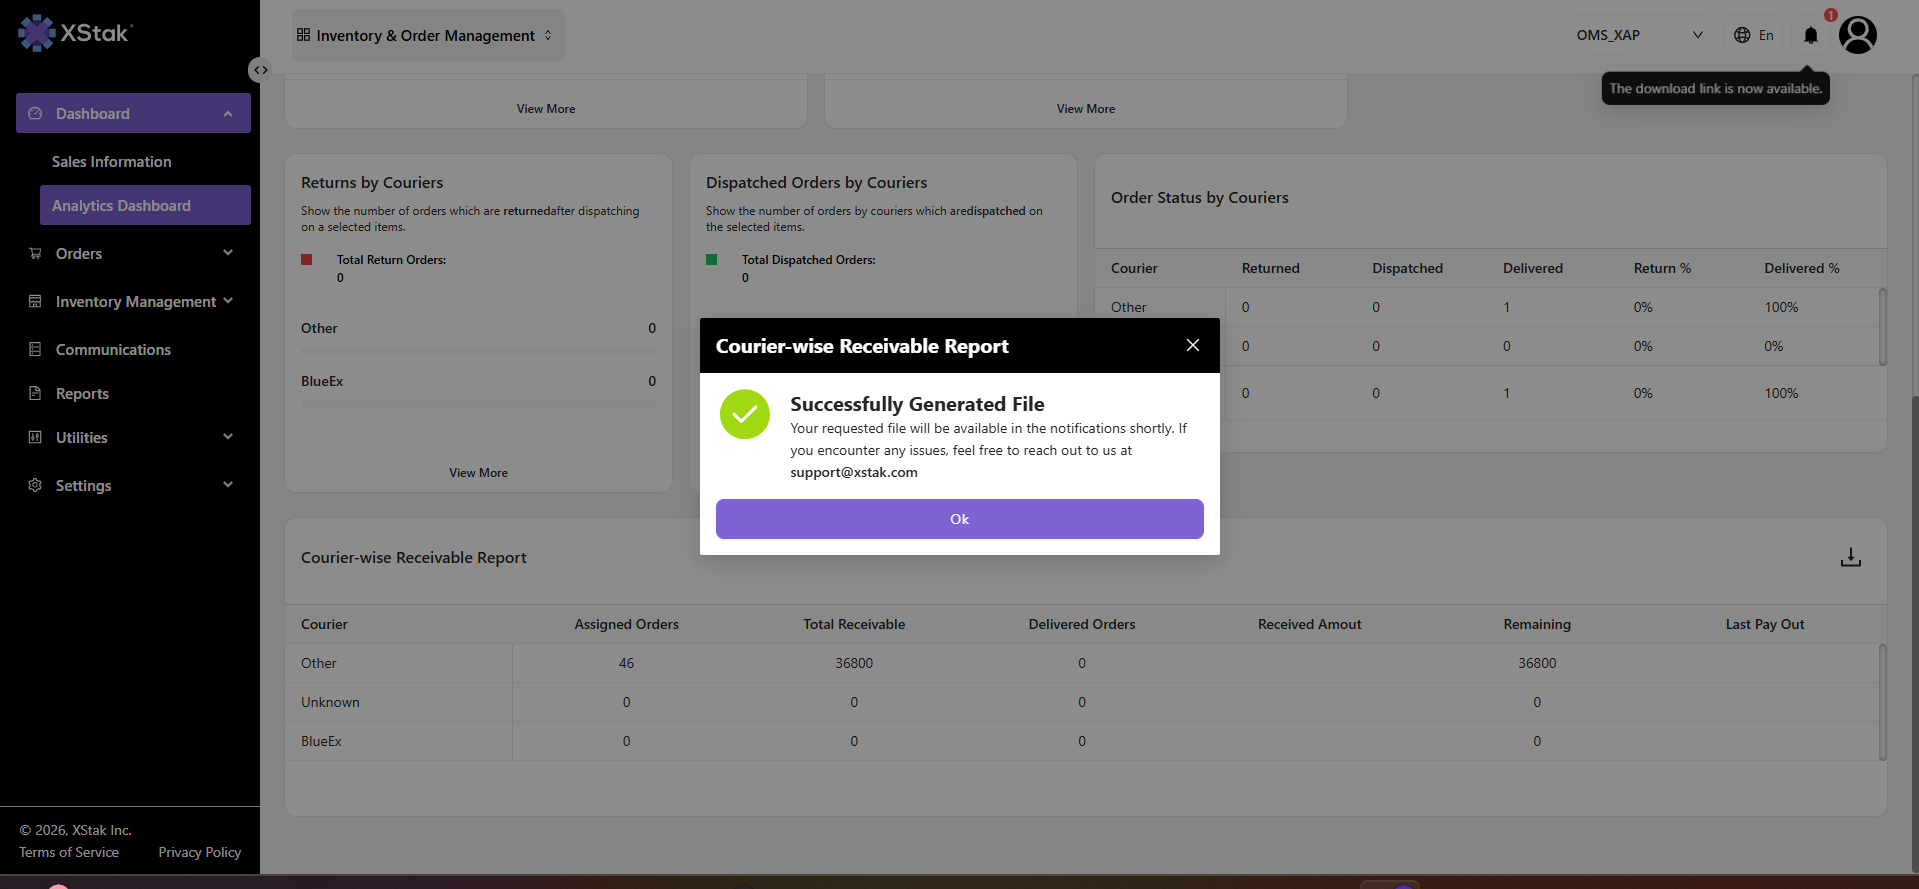
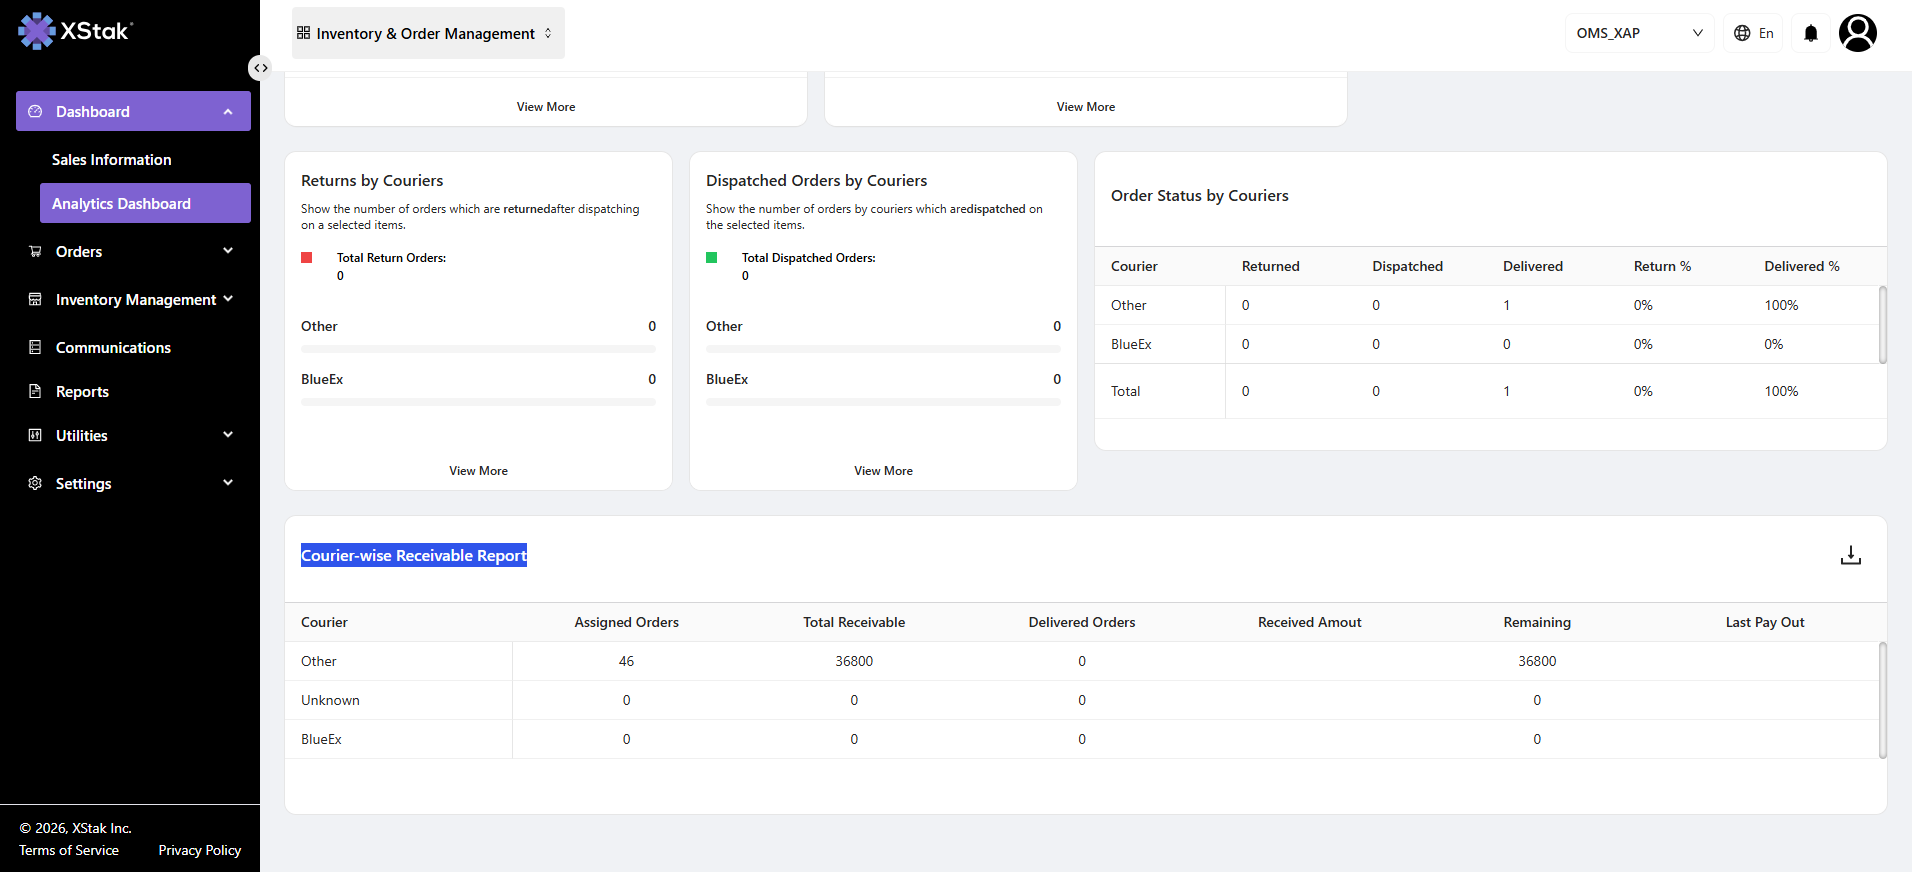
Courier-wise Receivable Report
This section shows financial reconciliation data for courier partners.
It includes assigned orders, receivables, delivered orders, received amounts, and remaining balances.
It is used for:
-
Courier payment tracking
-
Financial settlement monitoring
-
Outstanding balance management
Download Functionality
Users can download the Courier Receivable Report directly from the Download option available on the right corner.
This exported file contains detailed courier-wise financial data for external analysis, reconciliation, and reporting purposes.