Sales Information Dashboard
This page is intended for OMS users, operations teams, finance teams, and business stakeholders who need to monitor sales performance, revenue movement, order flow, and inventory health from the Sales Information dashboard.
The Sales Information section provides a business performance and revenue-focused view of the organization. It is designed to help teams monitor sales, track order flow, analyze inventory movement, and understand revenue trends across different dimensions.
This section focuses on answering key business questions such as:
-
How much are we selling?
-
What is the status of current orders?
-
Where is revenue being generated or lost?
-
How is inventory performing against sales?
How to Use Sales Information
-
Navigate to Dashboard → Sales Information
-
Use the tab navigation at the top to switch between views:
-
Overview
-
In Pipeline
-
Lost Revenue
-
Returned Revenue
-
Inventory
-
Cancel Reasons
-
Returned Reasons
-
Others
-
Each tab provides a focused dataset for a specific business function.
Prerequisites
-
Access to the OMS application with permission to view Dashboard reports.
-
Assigned access to the Sales Information module and relevant store, warehouse, or channel data.
-
If the Sales Information option is not visible, contact your system administrator to confirm role permissions.
Filters & Interactions
Use the available filters to narrow the dashboard data by date range, store, channel, warehouse, location, SKU, or order status where applicable. Refresh the page or reapply filters to view the latest available figures.
Some views may support exporting or downloading data for offline analysis, depending on your account permissions and product configuration.
Key Metrics at a Glance
|
Metric |
What it tells you |
|---|---|
|
Total orders |
Overall order volume for the selected filters or time period. |
|
Units sold |
Total quantity of products sold across selected dimensions. |
|
Revenue |
Total generated, pending, lost, or returned revenue depending on the selected tab. |
|
Average order value |
Average revenue generated per order. |
|
Inventory availability |
Current stock position and how effectively inventory is converting into sales. |
|
Cancellation and return ratio |
Operational impact of cancelled and returned orders on overall revenue. |
Data freshness note: The dashboard provides a near real-time view of business performance. Exact refresh frequency may vary by configuration, so refresh the dashboard when validating the latest figures.
Key Sections Explained
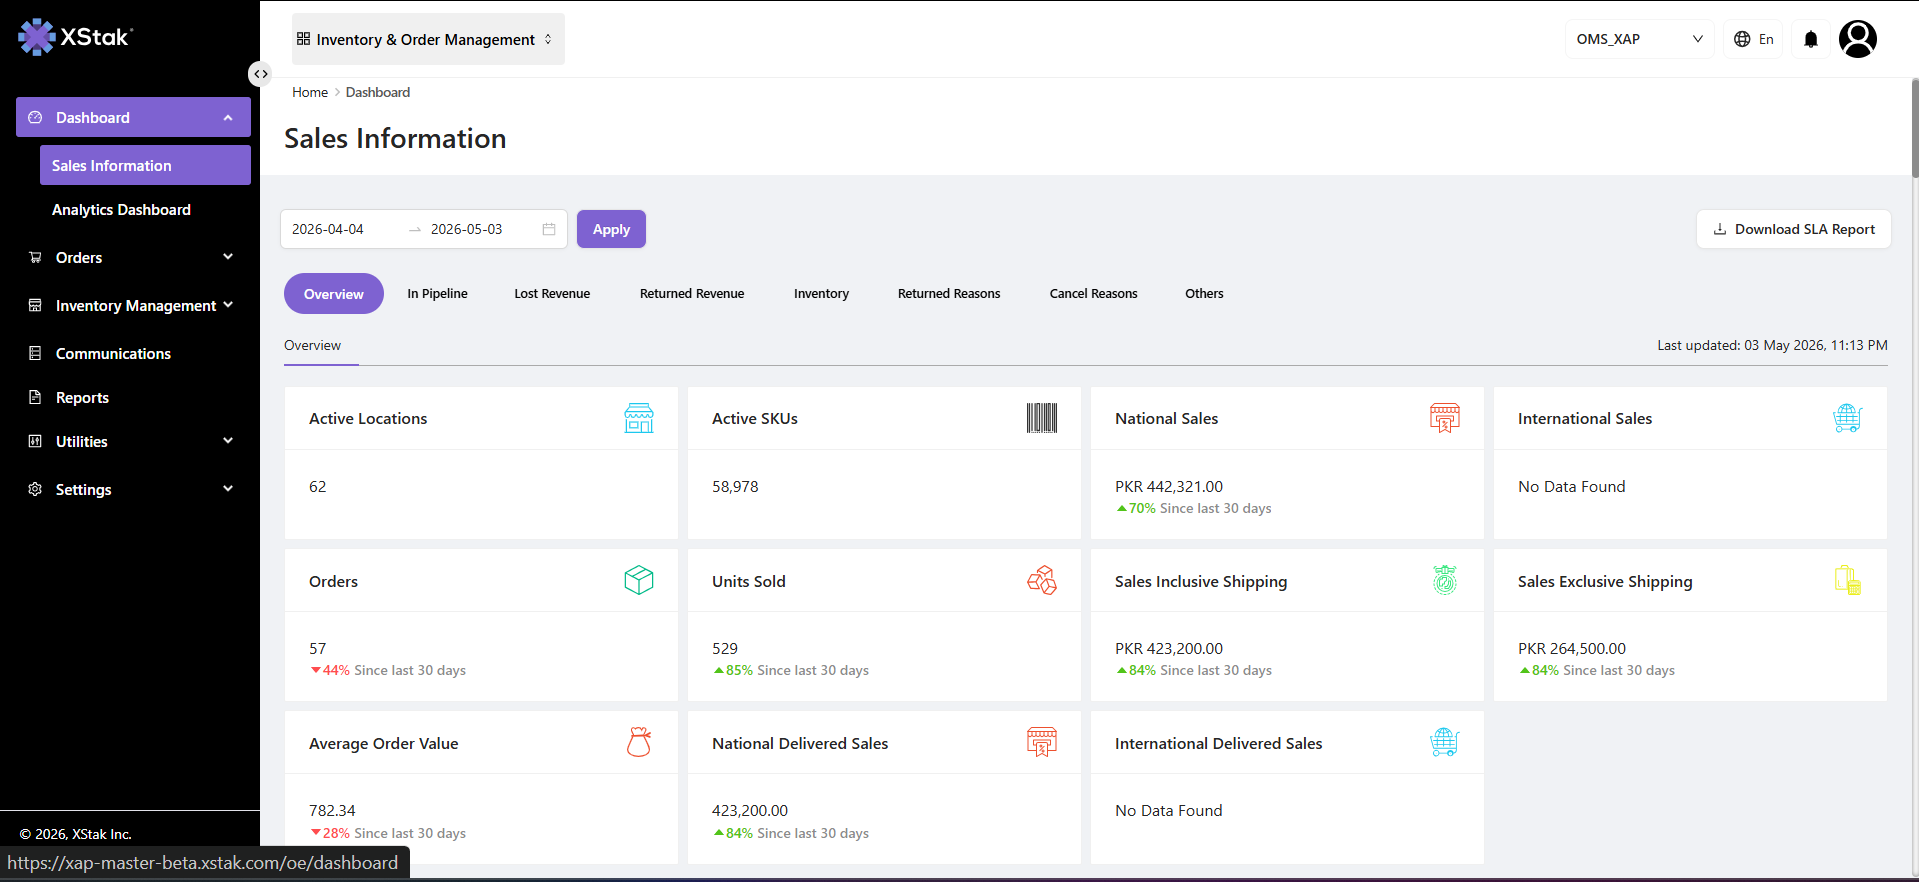
Overview
Provides a high-level snapshot of business performance including:
-
Total orders and units sold
-
National and international sales
-
Average order value
-
Delivered sales performance
-
Active locations and SKUs
This section is used for quick business health monitoring.
In Pipeline
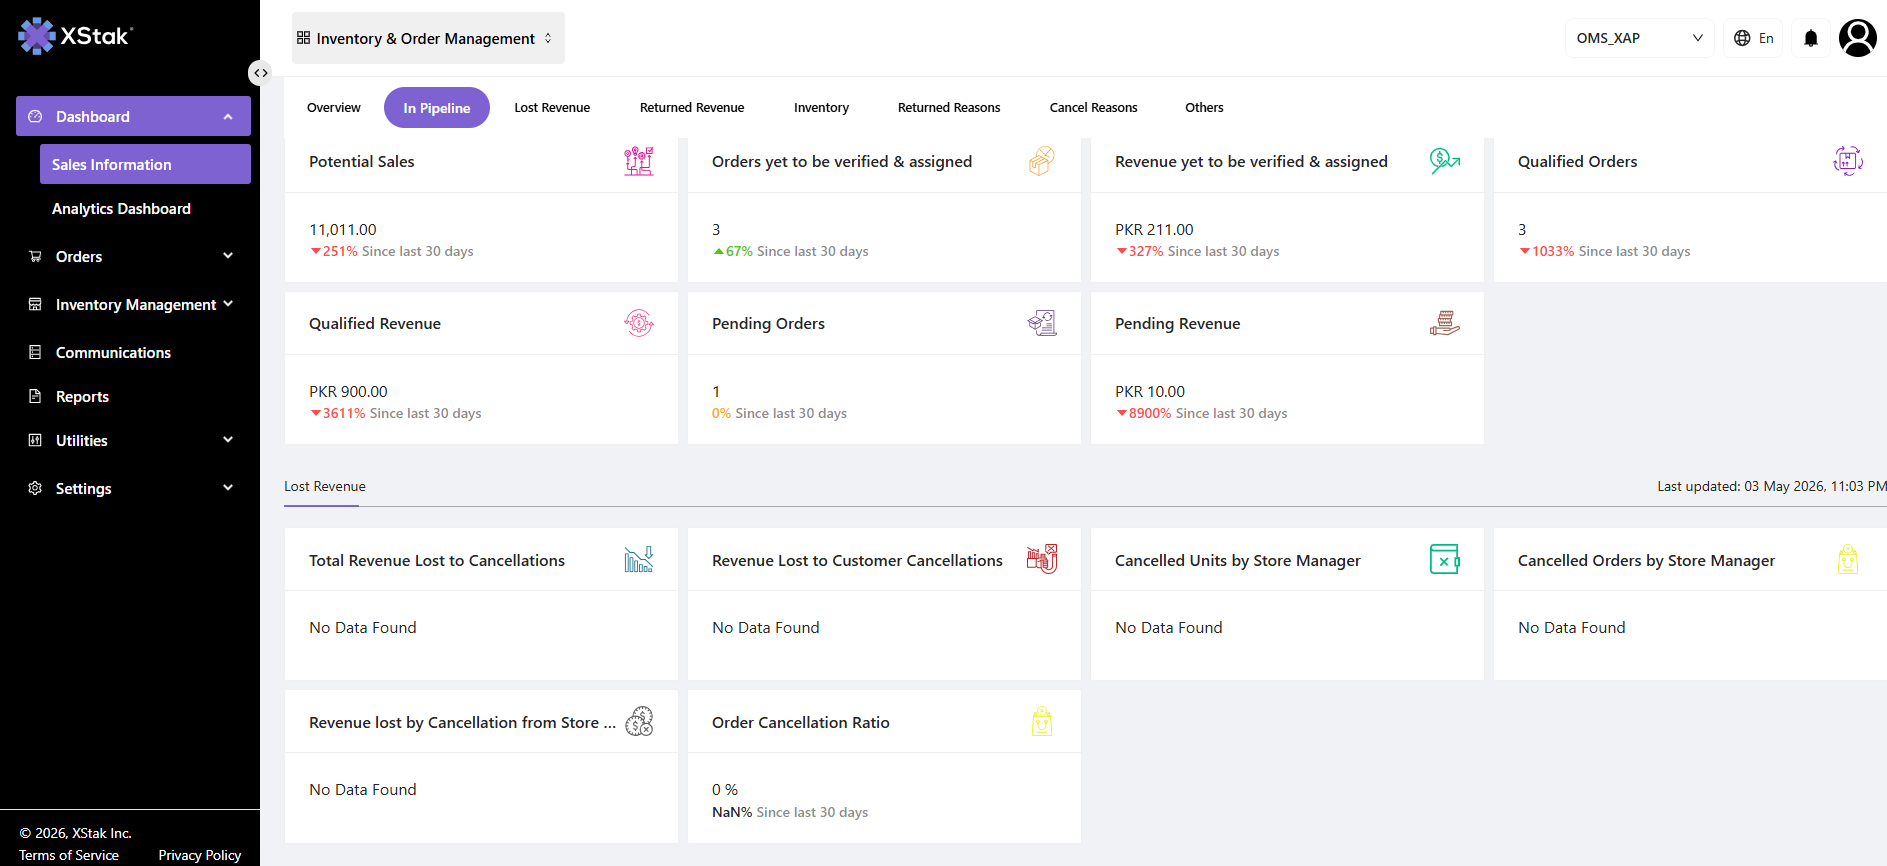
Displays all active and incomplete orders and revenue that are still being processed.
It helps teams track:
-
Orders awaiting verification or assignment
-
Pending revenue
-
Orders in fulfillment stages
-
Qualified and active order value
This section represents future or unrealized revenue in progress.
Lost Revenue
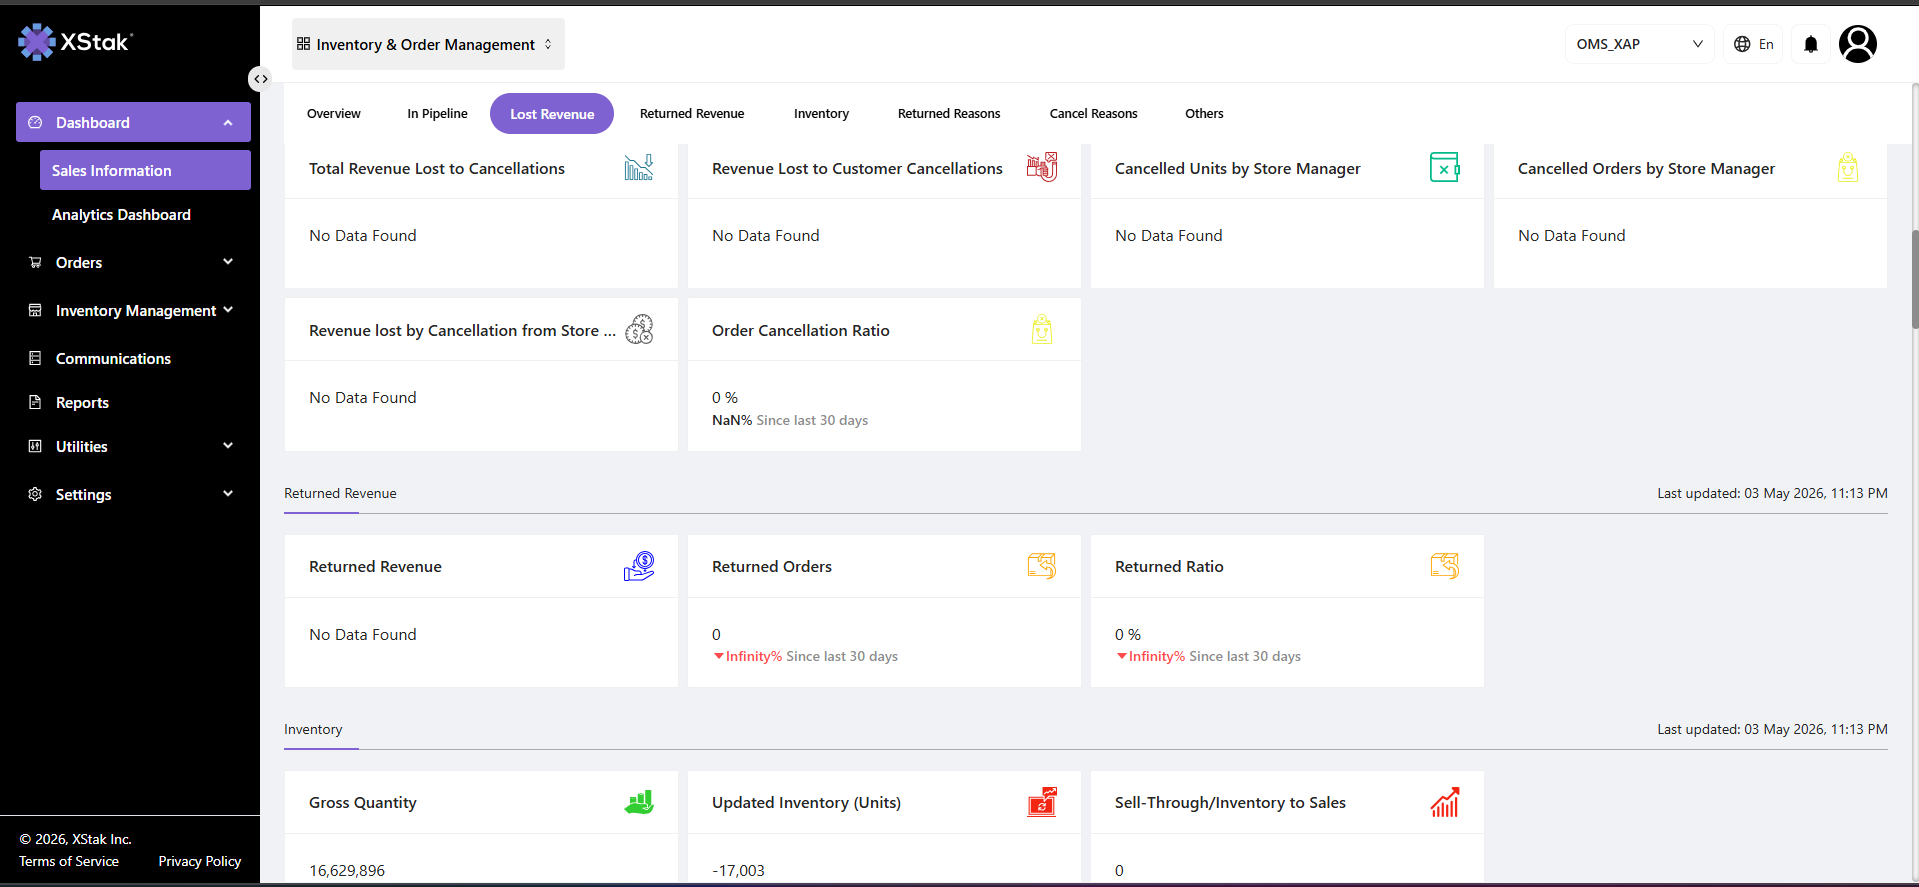
Tracks revenue lost due to cancellations at different levels including customers and internal operations.
It provides insights into:
-
Cancellation impact on revenue
-
Store-level cancellations
-
Overall cancellation ratio
This section is critical for identifying revenue leakage patterns.
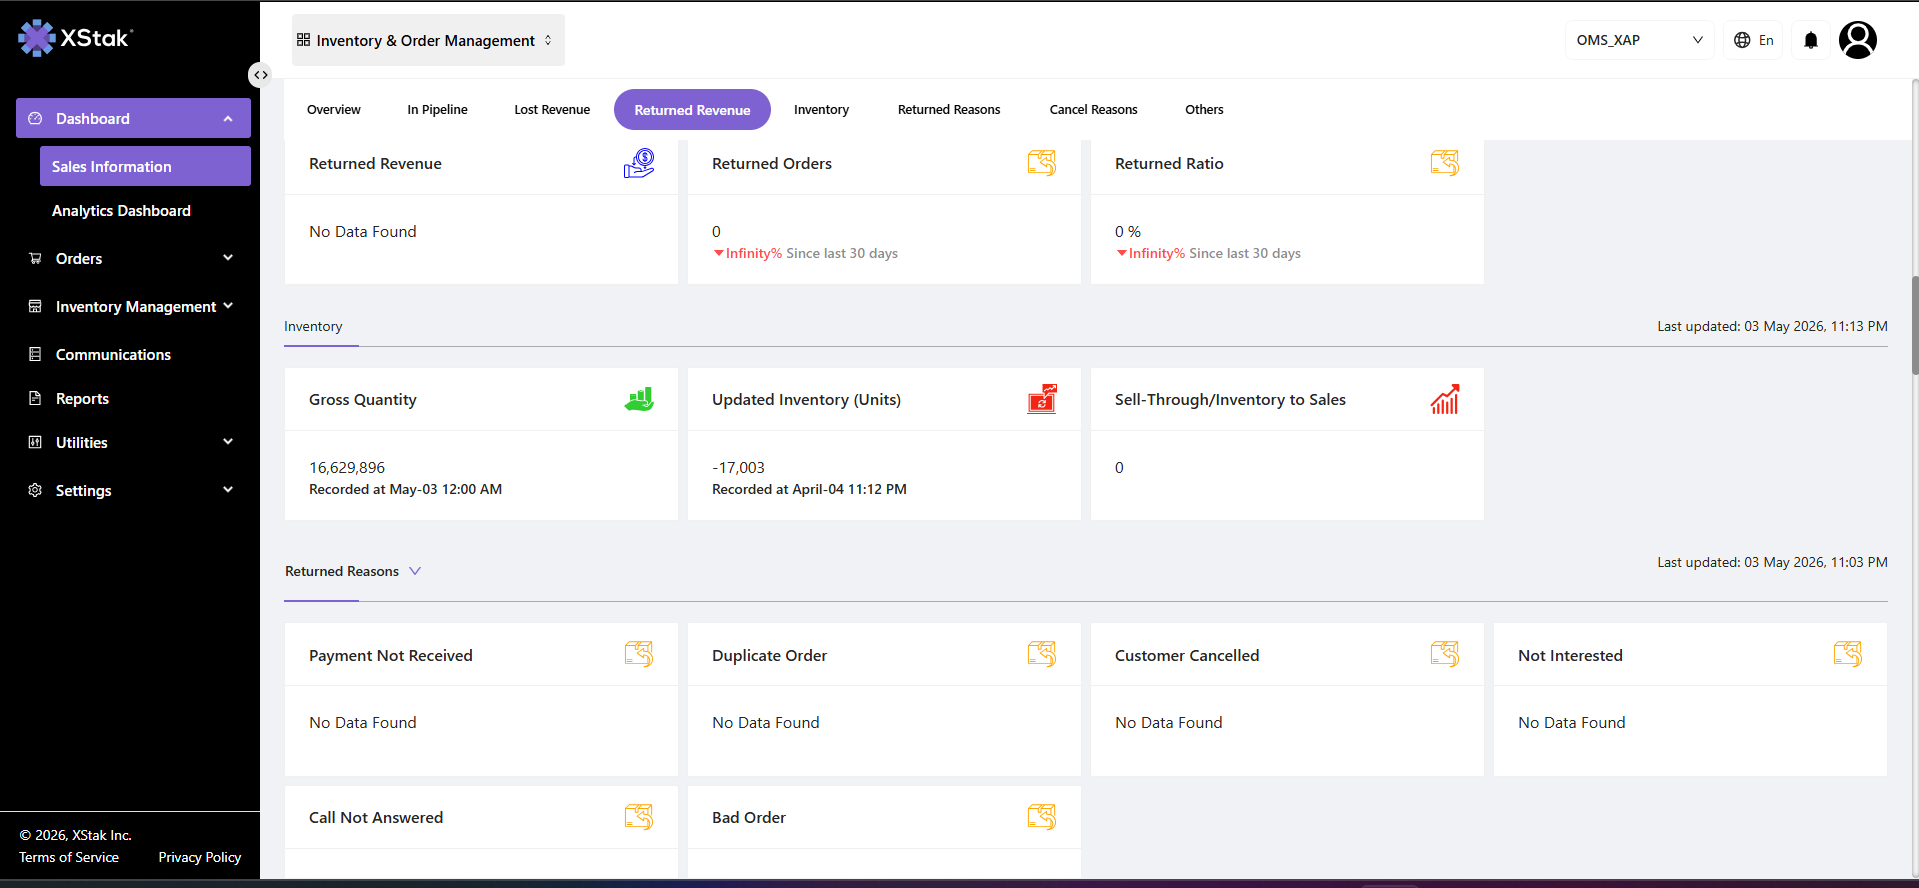
Returned Revenue
Displays financial impact of returned orders, including:
-
Total returned revenue
-
Returned order count
-
Return ratio
It helps analyze post-delivery customer behavior and product issues.
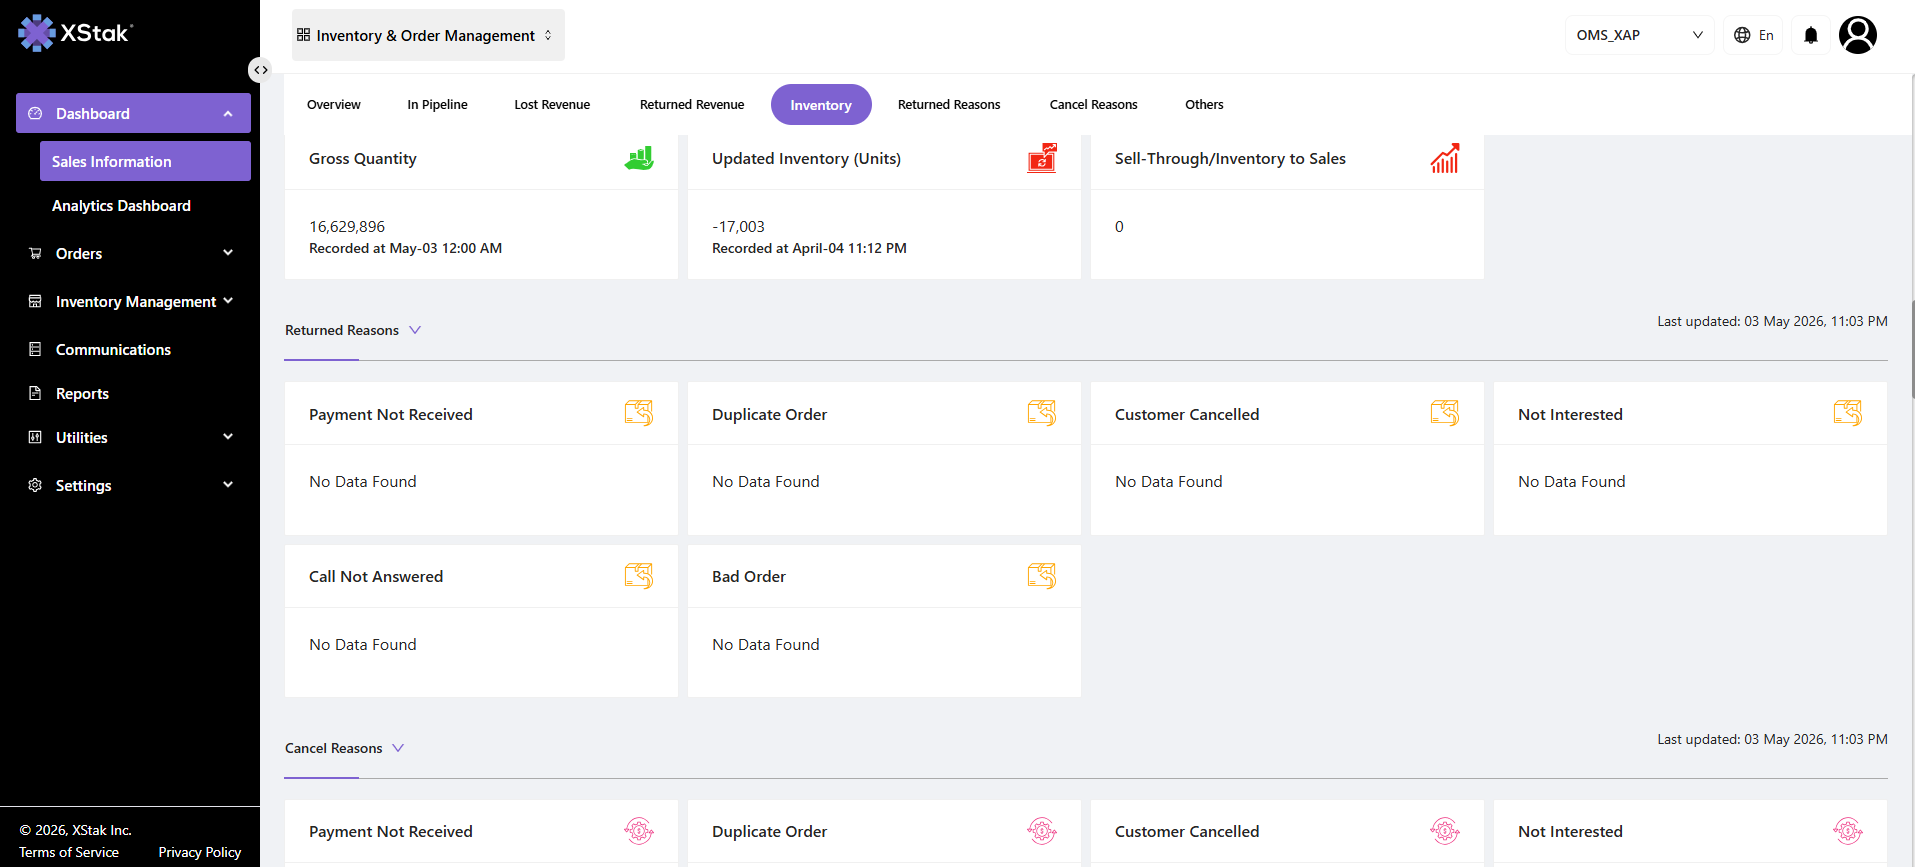
Inventory
Provides a snapshot of stock performance including:
-
Total available inventory
-
Updated stock levels
-
Sell-through rate
This section helps measure how effectively inventory is being converted into sales.
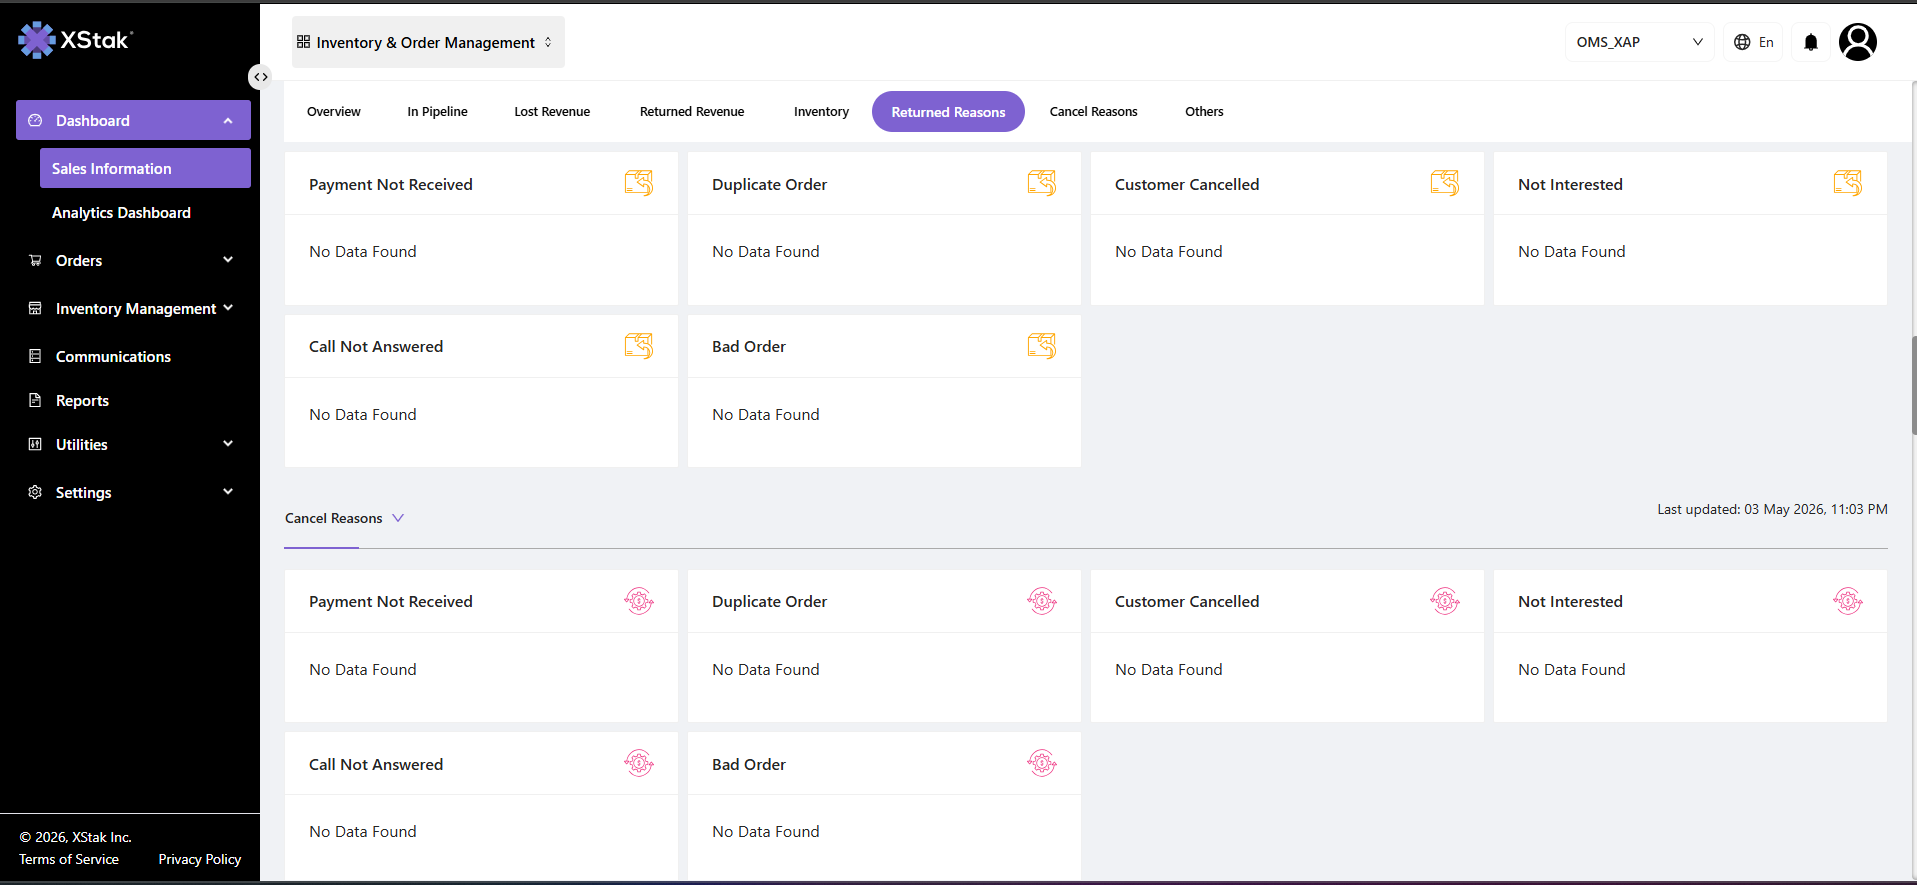
Cancel & Return Reasons
Breaks down operational reasons behind cancellations and returns such as:
-
Payment failure
-
Duplicate orders
-
Customer rejection
-
Unavailability or non-response
This is used for root cause analysis and process improvement.
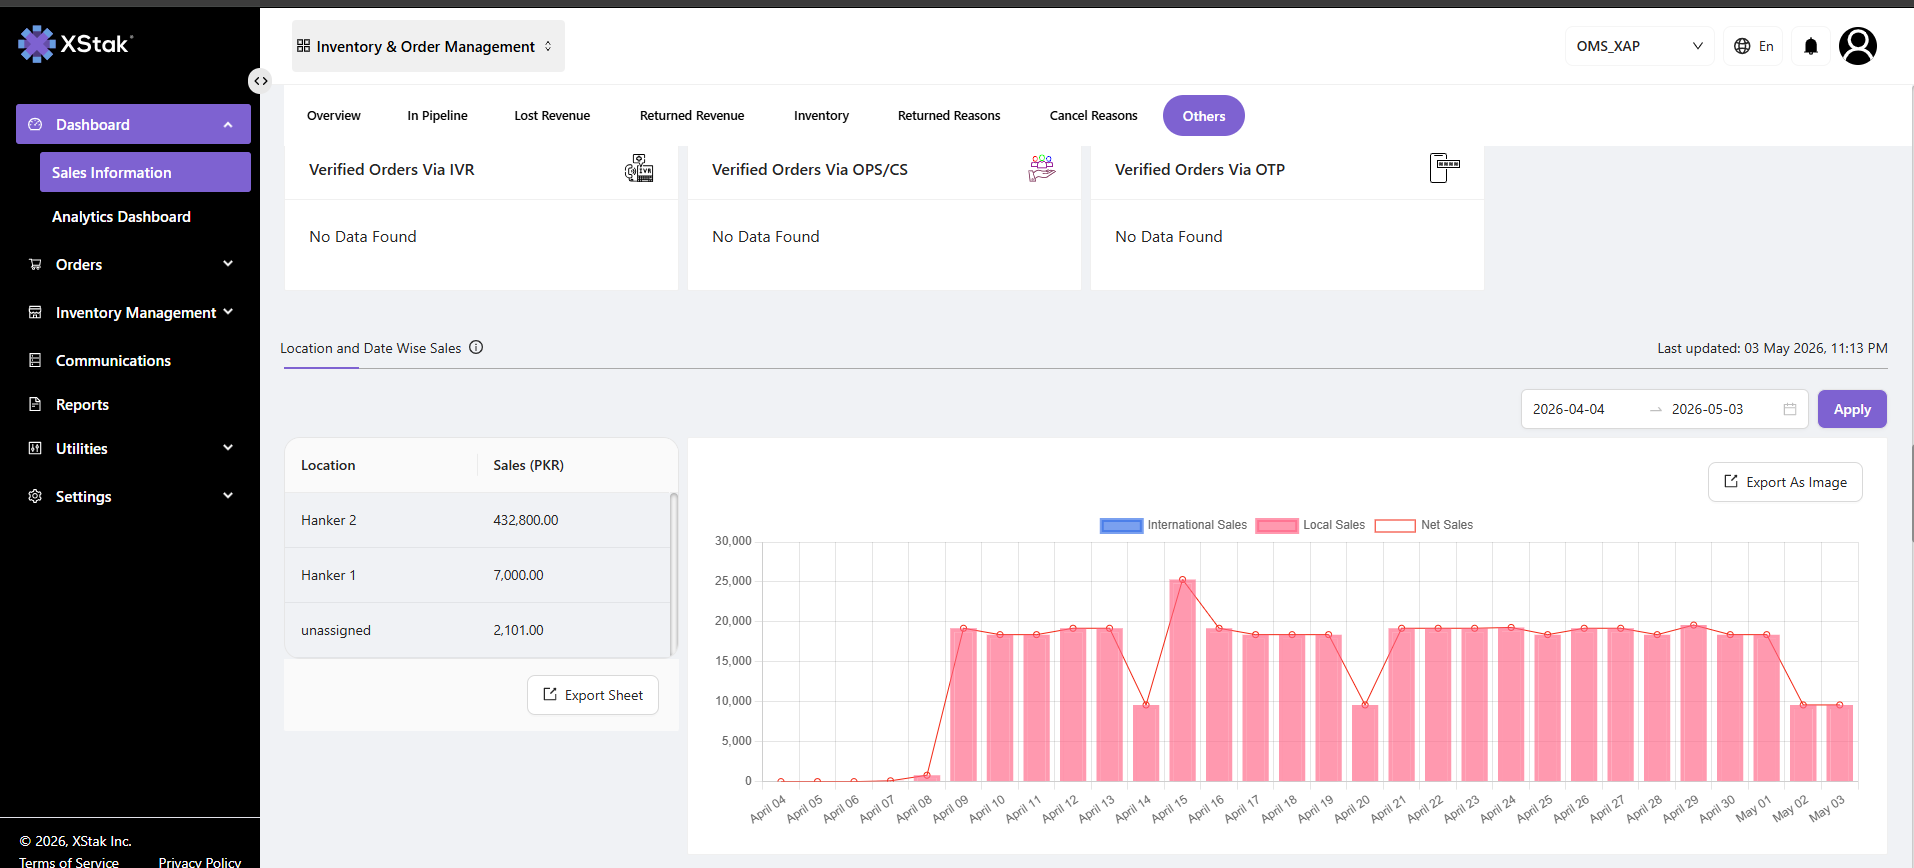
Others
Shows verification methods used for order validation:
-
IVR verification
-
OTP verification
-
Operations/Customer Support verification
This helps track order authenticity and validation efficiency.