In this chapter of the manual, we will learn how to use the different features of XStak’s POS BI Analytical Dashboard and what the tiles represent.
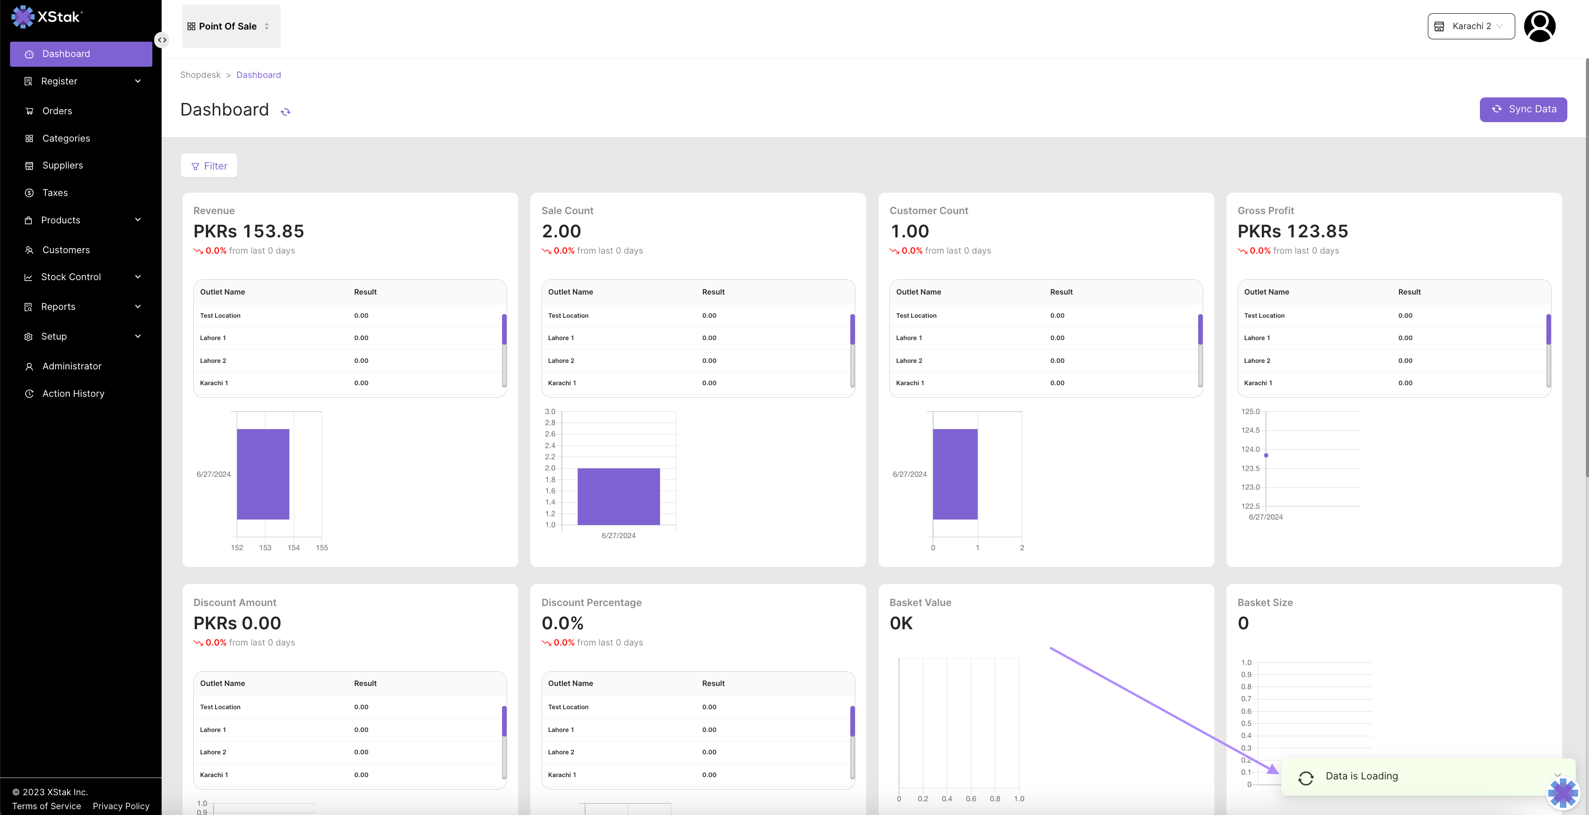
a) Once you log in, you will see a screen telling you that the Data is loading, this feature is useful if you are planning to use the POS in offline mode (In case there is no internet). We will be discussing this in the chapters to come.
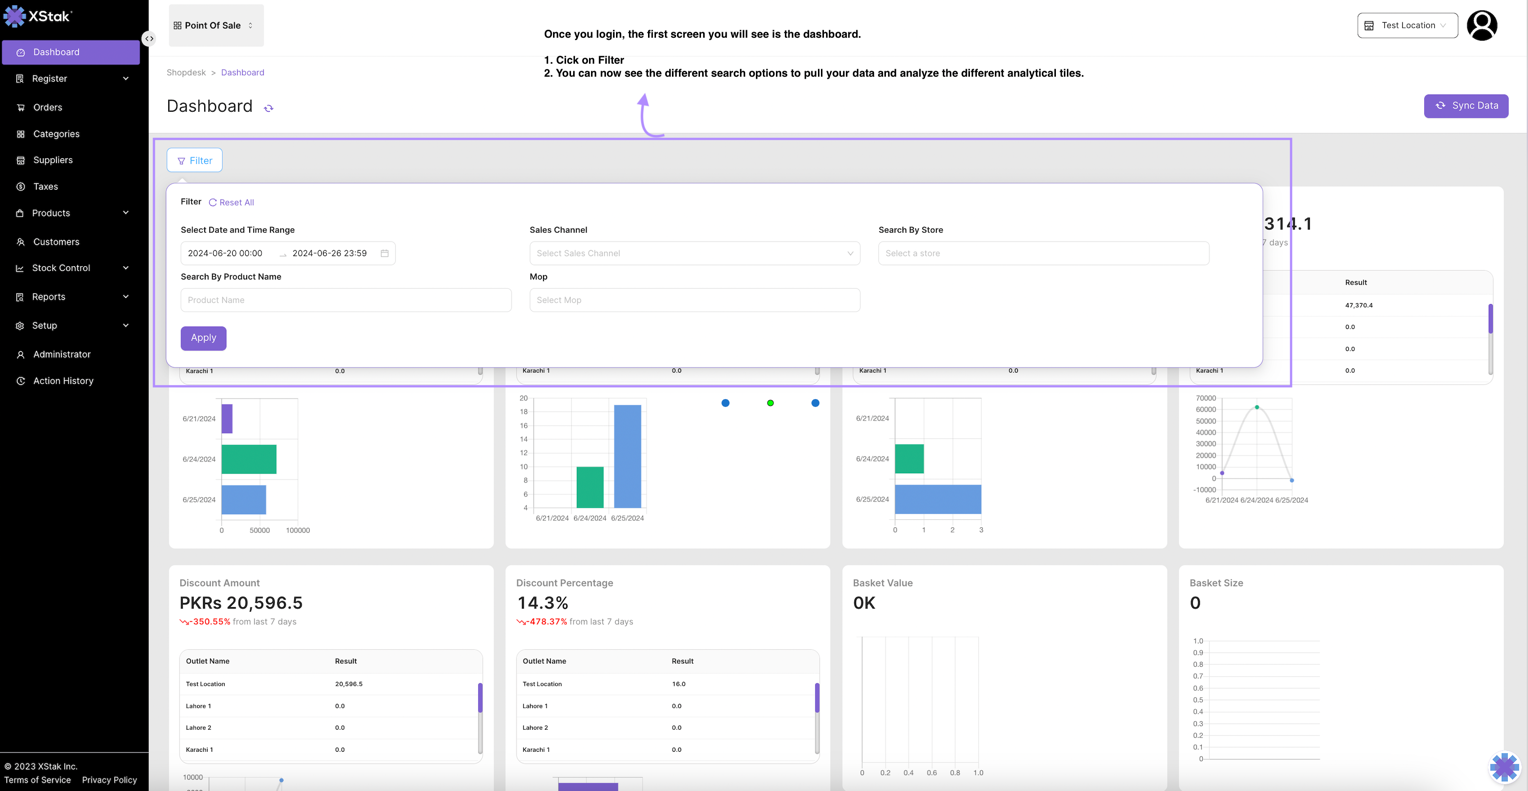
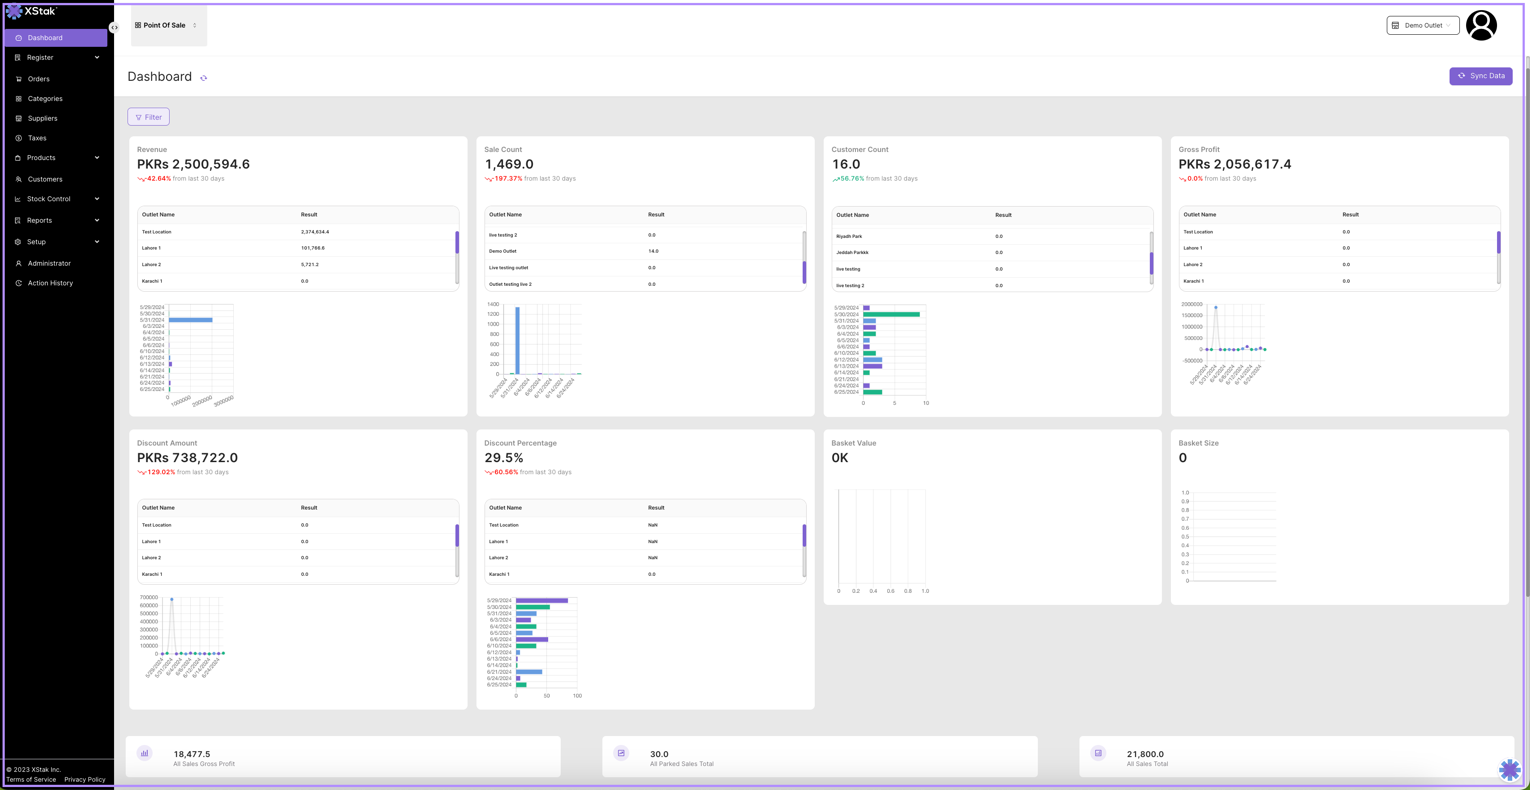
b) You can use the filters to see different data on the dashboard such as; revenue, profits, discounts, sales count, and much more.